

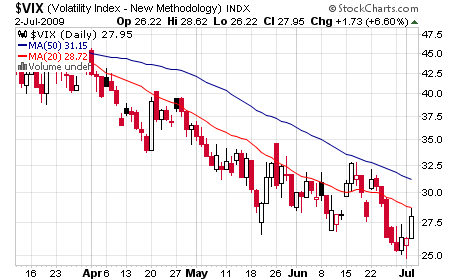
Chart courtesy of StockCharts.com
On Thursday of last week, the volatility index (VIX) spiked 6.6% in the face of a broad market selloff. This move, however, comes after about two weeks' worth of a decline in the VIX, which occurred even as stocks slid. What does this mean for the stocks in the short term?
During a pullback, it is helpful to know the likelihood of investors buying or selling into the weakness. Since the markets are currently declining down towards key points of support (S&P 890 and 875), investors could either reload at those points or sell off in order to prevent further losses. The VIX suggests which way investors are likely to go.
In this case, if the VIX continues to spike then it is more likely that the S&P will break through its support levels. The higher VIX reading would suggest that investors are more concerned about the market falling out from under them, making investors more prone to panic selling. It would discourage new long positions by making put protection more expensive. If the VIX declines back towards its levels from early last week, however, then investors would be more comfortable reloading on long positions because panic selling is less likely and put protection is cheaper. So for a hint at what the markets will do once they hit the next support levels, watch the VIX until they get there.